Photo by CHUTTERSNAP on Unsplash
In order to gauge the future of the climate, one needs to take a close look at energy permitting. Permitting is where lofty climate goals and easy promises are stripped away, exposing the bare face of a country’s commitment to clean energy transition. For South Korea, the past two decades of permitting history reveal notable progress, but some experts believe it still falls short of what is needed to achieve its 2050 net zero goal.
South Korea, smaller in size than many of its peer countries, plays an outsized role in climate change due to its heavy coal imports and high per-capita emissions. At almost 12 tons, Korea ranks 15th in the world for per-capita emissions, according to the data from World Bank.
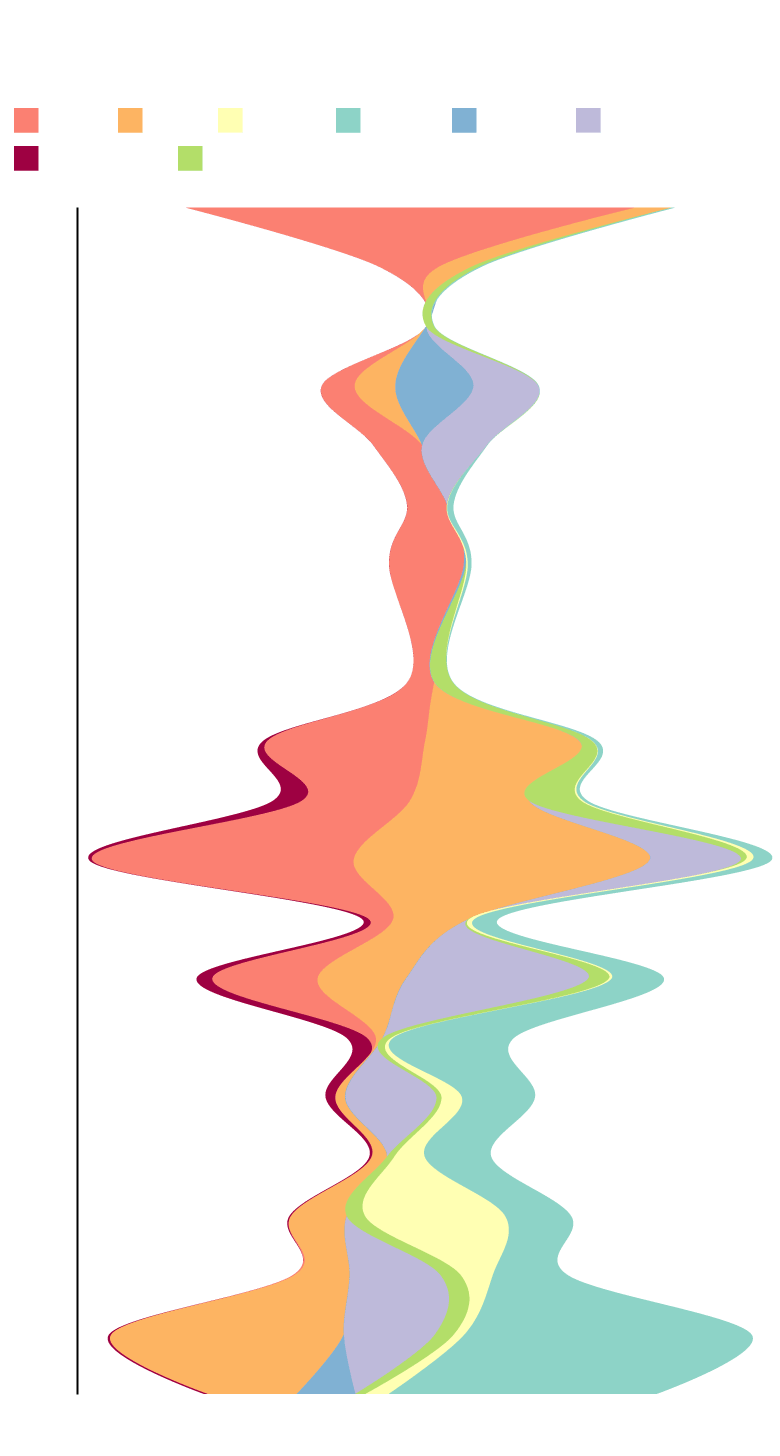
The following graph illustrates South Korea’s permitting history since 2002, the year Korea Electricity Regulatory Commission (KOREC) was first established. KOREC is a governmental agency under the Ministry of Trade, Industry, and Energy, and oversees all energy projects bigger than 3 MW.
The data, obtained from the KOREC website, was converted from a pdf document into a searchable database format, which was then cleaned and analyzed for further exploration. The data only shows newly obtained permits and the capacity of the plant at the time of the approval. It may not reflect the changes made after the initial permit, such as changes in capacity, location, ownership, and energy source.
The graph reveals that while there was a dramatic increase in renewable energy permitting in the past decade, fossil fuel plants still persist, complicating the picture of Korea’s clean-energy transition. While there has been no new coal permits since 2015, several new gas plants have been permitted. Wind farms, which were negligible up until 2016, gained significant capacity since then, being the most permitted power source in 2022 so far.
In 2021, Solutions for Our Climate and Korea Advanced Institute of Science & Technology (KAIST) published a joint report that laid out multiple scenarios for Korea to achieve its net-zero goals. The report suggested that in order to achieve carbon neutrality by 2050, Korea needs to increase its flexible resource power generation “by 150% and 250%, respectively, between 2020 and 2050.”
The size of each point reflects logarithmic scale of each plant's generation capacity. The data shows newly obtained permits and the capacity of the plant at the time of the approval.
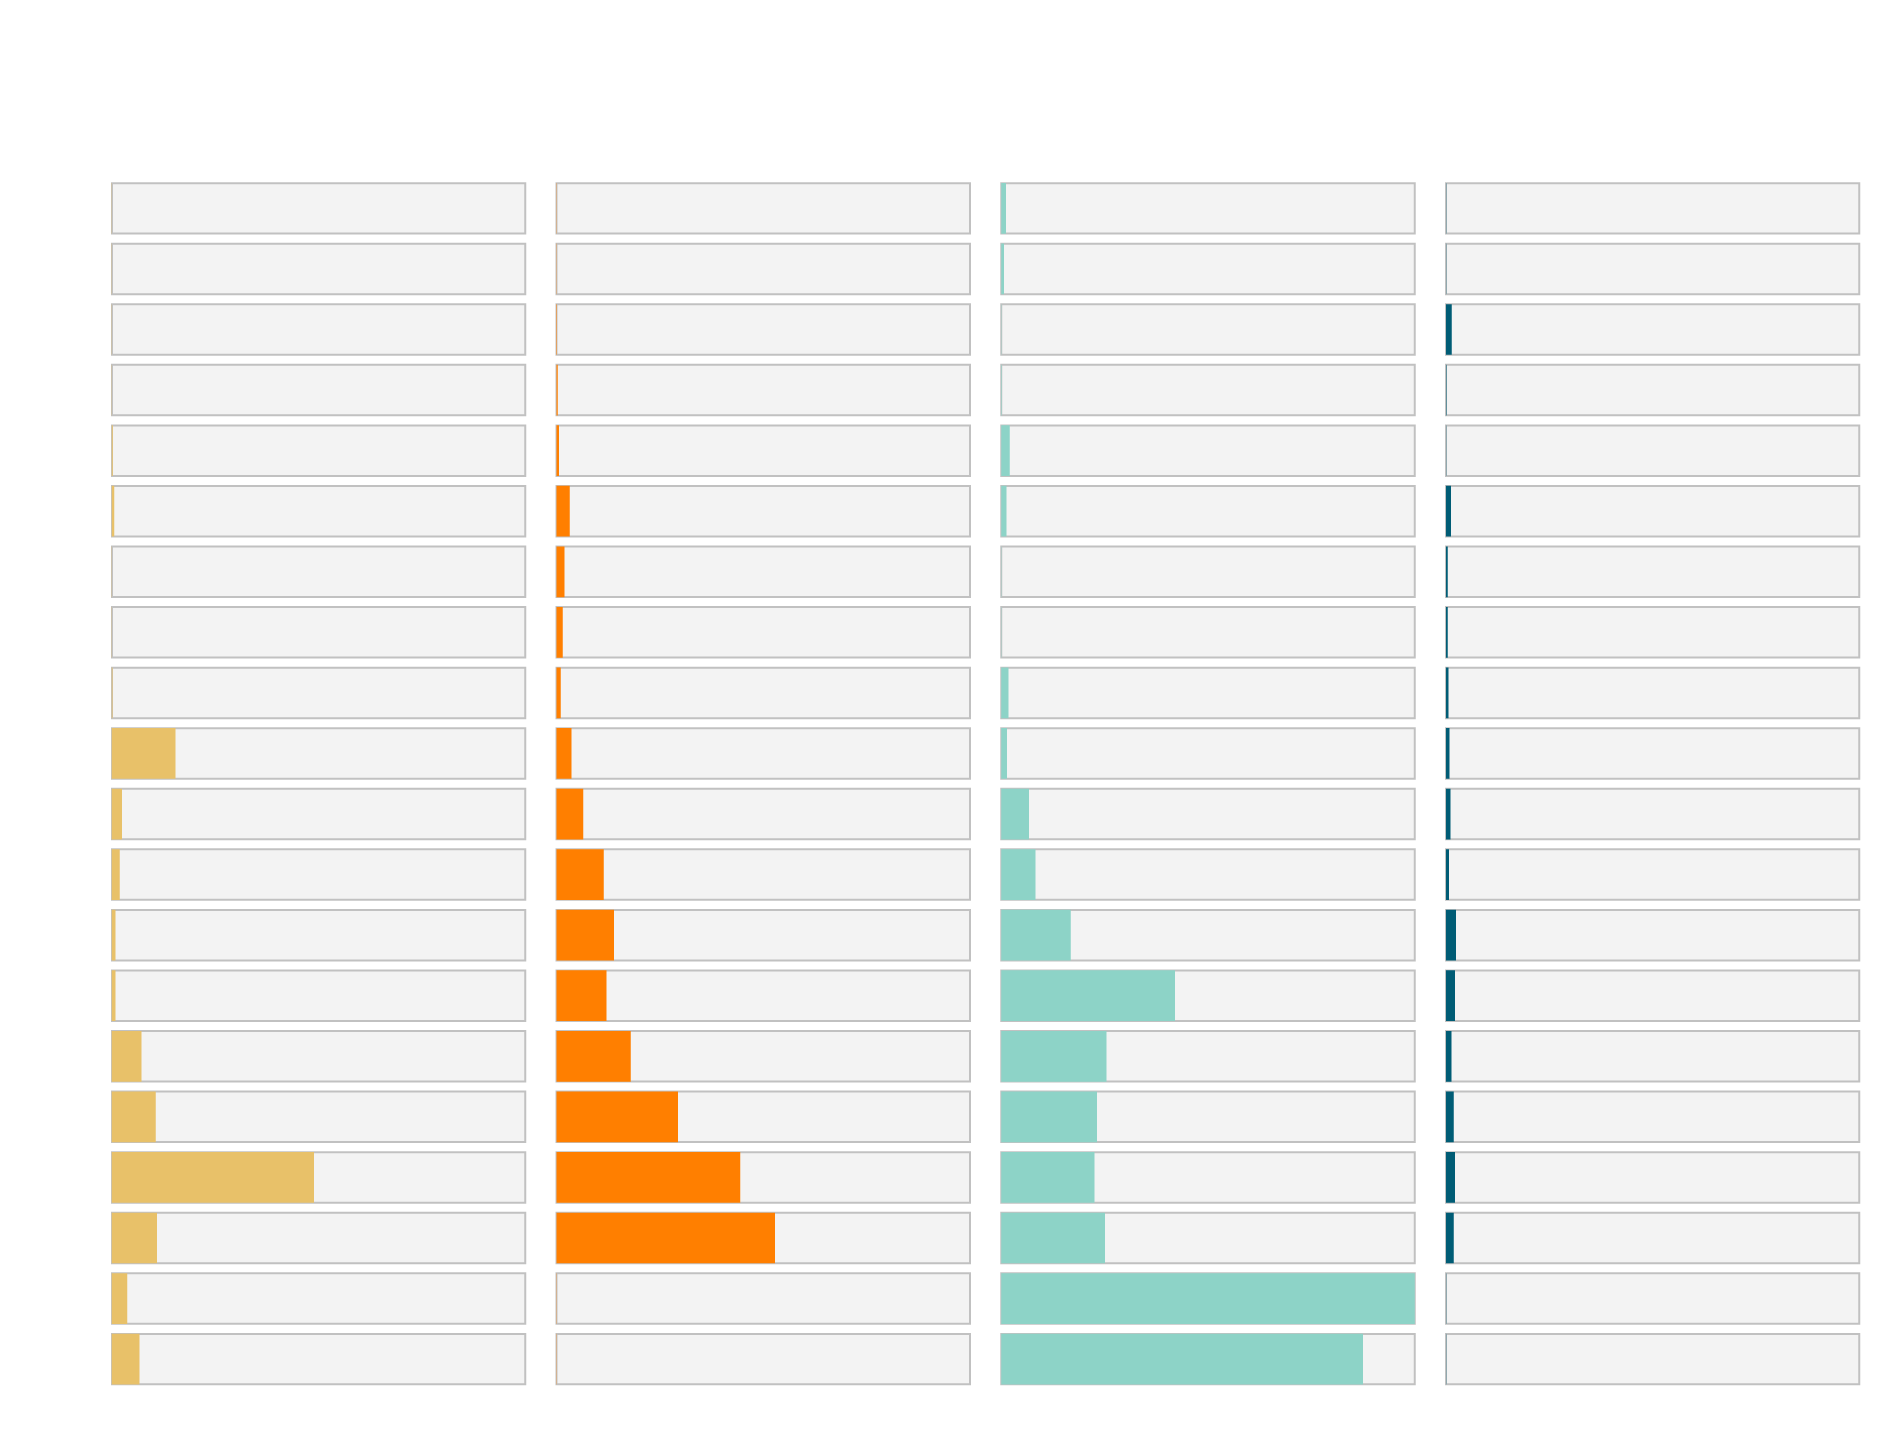
While KOREC’s permitting records are meaningful indicators of Korea’s energy future, their usefulness as predictors of renewable energy increase may vary. In solar, for example, the increase in permits was roughly followed by an increase in generation over the past decade, with a 2-3 year delay
However, wind power permits, which have dramatically increased in the past decade, did not show the same trend. While KOREC’s yearly wind permits have been steady at above the 2GW range, the new generation capacity for wind has been negligible.
Compared to solar, wind power has many more hoops to jump through when it comes to permitting, especially around land use,” said Eunbyul Jo, a renewable energy researcher at the South Korea-based think tank Solutions for Our Climate. “Aside from KOREC’s energy business permit, wind, specifically offshore wind, needs to comply with Public Waters Management And Reclamation Act.”
The act requires offshore wind projects to gain land use permission, which often gets delayed by several years due to opposition from nearby fisheries and some environmental activists who are concerned about the impact of the wind turbine on the ecosystem. Some wind projects have been put on hold for more than a decade due to the complex permitting process.
Despite the slow growth in wind generation, Jo says a recent KOREC permit for wind is a positive sign for the industry. “While KOREC’s permitting is only a piece of the puzzle, it is a big one,” she said. “We just need to streamline other permitting processes to really boost wind capacity in Korea.”